div dates jan 2022
- Get link
- Other Apps
| 9 | $102.23 | 1.33% | 14.3% | 0.34 | 01/18 | |
| Ex-Div Date: 01/04 (Last Day to Buy: Monday, 01/03) | ||||||
| Comcast Corporation (CMCSA) | 14 | $50.51 | 1.98% | 12.8% | 0.25 | 01/26 |
| Cisco Systems, Inc. (CSCO) | 11 | $63.53 | 2.33% | 9.2% | 0.37 | 01/26 |
| Erie Indemnity Company (ERIE) | 31 | $194.17 | 2.29% | 7.2% | 1.11 | 01/20 |
| The First of Long Island Corporation (FLIC) | 25 | $21.85 | 3.66% | 13.7% | 0.2 | 01/14 |
| Parke Bancorp, Inc. (PKBK) | 8 | $21.02 | 3.04% | 24.9% | 0.16 | 01/19 |
| Riverview Bancorp, Inc. (RVSB) | 8 | $7.71 | 2.85% | 22.5% | 0.055 | 01/17 |
| Ex-Div Date: 01/05 (Last Day to Buy: Tuesday, 01/04) | ||||||
| ABM Industries Incorporated (ABM) | 54 | $41.08 | 1.90% | 2.9% | 0.195 | 02/07 |
| HEICO Corporation (HEI) | 17 | $144.52 | 0.12% | 15.7% | 0.09 | 01/20 |
| HEICO Corporation (HEI.A) | 18 | $128.84 | 0.14% | 15.7% | 0.09 | 01/20 |
| JPMorgan Chase & Co. (JPM) | 12 | $158.64 | 2.52% | 14.9% | 1 | 01/31 |
| Kadant Inc. (KAI) | 9 | $231.17 | 0.43% | 6.4% | 0.25 | 02/03 |
| Simpson Manufacturing Co., Inc. (SSD) | 8 | $137.51 | 0.73% | 7.3% | 0.25 | 01/27 |
| Ex-Div Date: 01/06 (Last Day to Buy: Wednesday, 01/05) | ||||||
| Acme United Corporation (ACU) | 17 | $33.80 | 1.54% | 5.4% | 0.13 | 01/28 |
| American Express Company (AXP) | 9 | $164.41 | 1.05% | 8.2% | 0.43 | 02/10 |
| Bristol-Myers Squibb Company (BMY) | 15 | $62.35 | 3.46% | 16.2% | 0.54 | 02/01 |
| Globe Life Inc. (GL) | 16 | $94.16 | 0.84% | 18.5% | 0.198 | 02/01 |
| Gentex Corporation (GNTX) | 12 | $35.01 | 1.37% | 6.8% | 0.12 | 01/19 |
| Horizon Bancorp, Inc. (HBNC) | 11 | $20.93 | 2.87% | 20.1% | 0.15 | 01/21 |
| Mastercard Incorporated (MA) | 11 | $360.78 | 0.54% | 18.7% | 0.49 | 02/09 |
| Morningstar, Inc. (MORN) | 10 | $345.61 | 0.42% | 7.9% | 0.36 | 01/31 |
| NetApp, Inc. (NTAP) | 9 | $93.26 | 2.14% | 21.6% | 0.5 | 01/26 |
| Owens Corning (OC) | 8 | $90.16 | 1.55% | 7.8% | 0.35 | 01/21 |
| Oracle Corporation (ORCL) | 12 | $88.65 | 1.44% | 13.3% | 0.32 | 01/19 |
| The Progressive Corporation (PGR) | 5 | $103.35 | 0.39% | -14.8% | 0.1 | 01/14 |
| Royal Gold, Inc. (RGLD) | 20 | $104.44 | 1.34% | 14.1% | 0.35 | 01/21 |
| Sysco Corporation (SYY) | 51 | $78.32 | 2.40% | 19.8% | 0.47 | 01/28 |
| First Financial Corporation (THFF) | 33 | $45.39 | 2.34% | 1.4% | 0.53 | 01/14 |
| Ex-Div Date: 01/07 (Last Day to Buy: Thursday, 01/06) | ||||||
| Brady Corporation (BRC) | 37 | $54.66 | 1.65% | 1.7% | 0.225 | 01/31 |
| Intuit Inc. (INTU) | 11 | $649.78 | 0.42% | 14.5% | 0.68 | 01/18 |
| Lincoln National Corporation (LNC) | 12 | $68.58 | 2.62% | 11.8% | 0.45 | 02/01 |
| OGE Energy Corp. (OGE) | 16 | $37.83 | 4.34% | 7.9% | 0.41 | 01/28 |
| Roper Technologies, Inc. (ROP) | 28 | $492.09 | 0.50% | 13.9% | 0.62 | 01/24 |
| Shoe Carnival, Inc. (SCVL) | 9 | $39.74 | 0.70% | 6.6% | 0.07 | 01/24 |
| AT&T Inc. (T) | 36 | $24.82 | 8.38% | 1.7% | 0.52 | 02/01 |
| UDR, Inc. (UDR) | 13 | $59.44 | 2.44% | 4.8% | 0.363 | 01/31 |
| Universal Corporation (UVV) | 51 | $54.39 | 5.74% | 7.9% | 0.78 | 02/07 |
| Verizon Communications Inc. (VZ) | 18 | $52.72 | 4.86% | 2.1% | 0.64 | 02/01 |
| Ex-Div Date: 01/10 (Last Day to Buy: Friday, 01/07) | ||||||
| Culp, Inc. (CULP) | 9 | $8.99 | 5.12% | 9.2% | 0.115 | 01/19 |
| MSC Industrial Direct Co., Inc. (MSM) | 18 | $84.61 | 3.55% | 11.8% | 0.75 | 01/25 |
Previous Post: Upcoming Ex-Dividend Dates: December 21, 2021-January 3, 2022
High-Quality Candidates
We use DVK Quality Snapshots to assess the quality of dividend growth stocks. This elegant and effective system employs five quality indicators and assigns 0-5 points to each quality indicator, for a maximum quality score of 25 points.
By assigning quality scores to all Dividend Radar stocks with upcoming ex-dates, we could screen for the highest-quality candidates. This week, seven stocks have quality scores of 23 or higher.
We present the quality scores, an assessment of fair value (whether Above, At, or Below fair value), and two measures of each stock's recent performance (1-year and 3-year trailing total returns [TTR]). Key metrics from the previous table are repeated here for convenience:

Source: Created by the authors from data in Dividend Radar and using DVK Quality Snapshots.
Dividend Radar views fair value as a range. Only two of these stocks are trading at discounted valuations below the fair value range.
For TTR, Dividend Radar provides 1-year and 3-year totals, adding the returns due to stock price appreciation (or depreciation) and dividend payments over each time frame. In the summary table, we highlight 3-year TTRs of 10% or higher in orange, and each 1-year TRRs that exceeds the 3-year TTR, in green (indicating stronger recent performance).
Five stocks have 3-year TTRs above 10% but only two of those have 1-year TTRs that exceed their 3-year TTRs, SYK and CMCSA.
We also color-code the Yield and 5-yr DGR columns, preferring dividend yields above 2.5% and 5-year dividend growth rates of 10% or higher.
BMY is the only one of this week's candidates that yields more than 2.5%. On the other hand, all the candidates except CSCO have a 5-year dividend growth rate above 10%.
An Interesting Candidate
Ideally, we'd like to see green cells in each of the Fair Value, 1-yr TTR, Yield, and 5-yr DGR columns. That rarely happens, though, so we look for a candidate that offers the best metrics overall, at least based on our current investment objectives.
We've highlighted all of these stocks before, but let's revisit Dividend Contender BMY:
BMY discovers, develops, licenses, manufactures, markets, distributes, and sells biopharmaceutical products worldwide. The company's pharmaceutical products include chemically synthesized drugs administered as tablets or capsules. It also uses biologics to produce products administered through injections or by infusion. BMY was founded in 1887 and is headquartered in New York, New York.
BMY is rated Excellent (quality score 23-24):
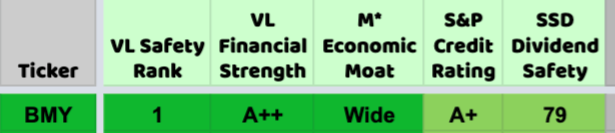
The stock yields 3.46% at $62.35 per share and has an impressive 5-year DGR of 16.2%. Over the past 10 years, BMY significantly underperformed the SPDR S&P 500 ETF (SPY), an ETF designed to track the 500 companies in the S&P 500 index:
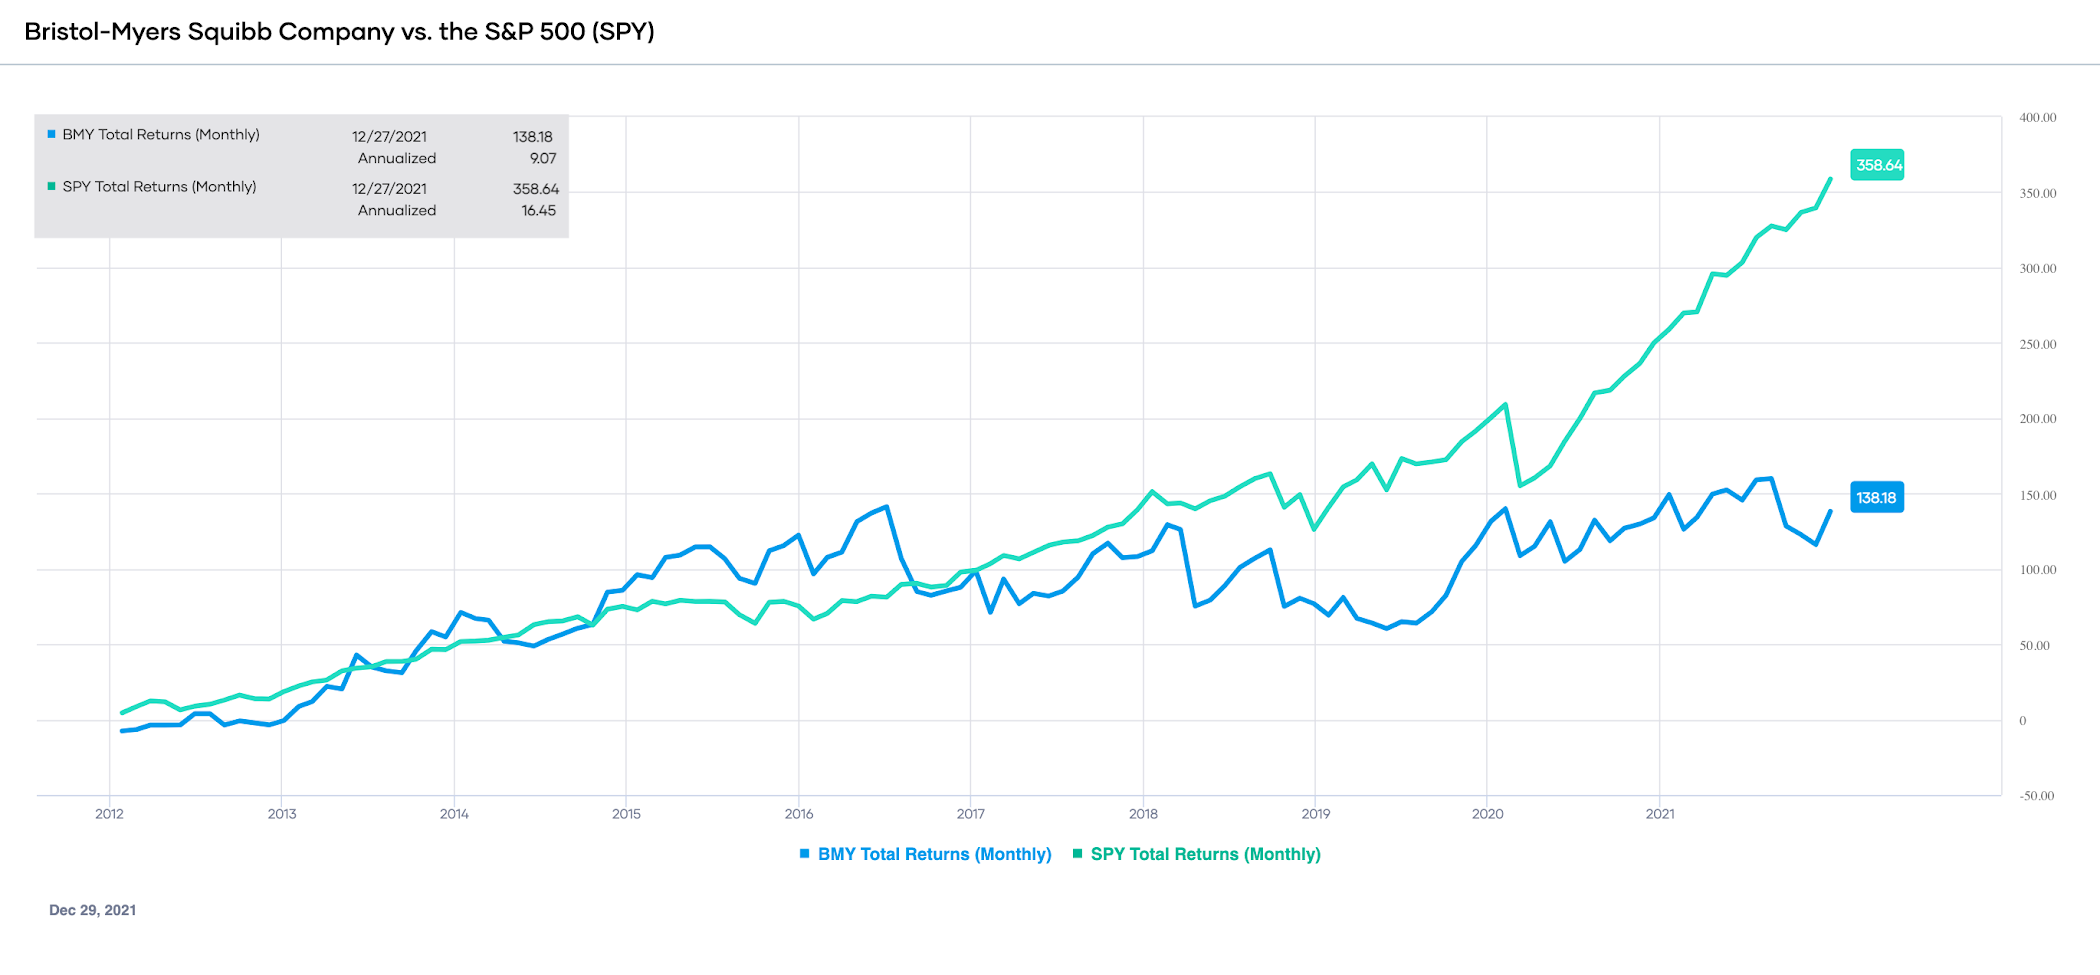
Source: Portfolio-Insight.com
BMY delivered total returns of 138% versus SPY's 359%, a margin of 0.38-to-1.
If we extend the time frame of comparison to the past 20 years, BMY also significantly underperformed SPY, in this case by a margin of 0.31-to-1. BMY's total returns over this period were 158% versus SPY's 504%.
Here is a chart showing BMY's dividend growth history through the end of 2020:
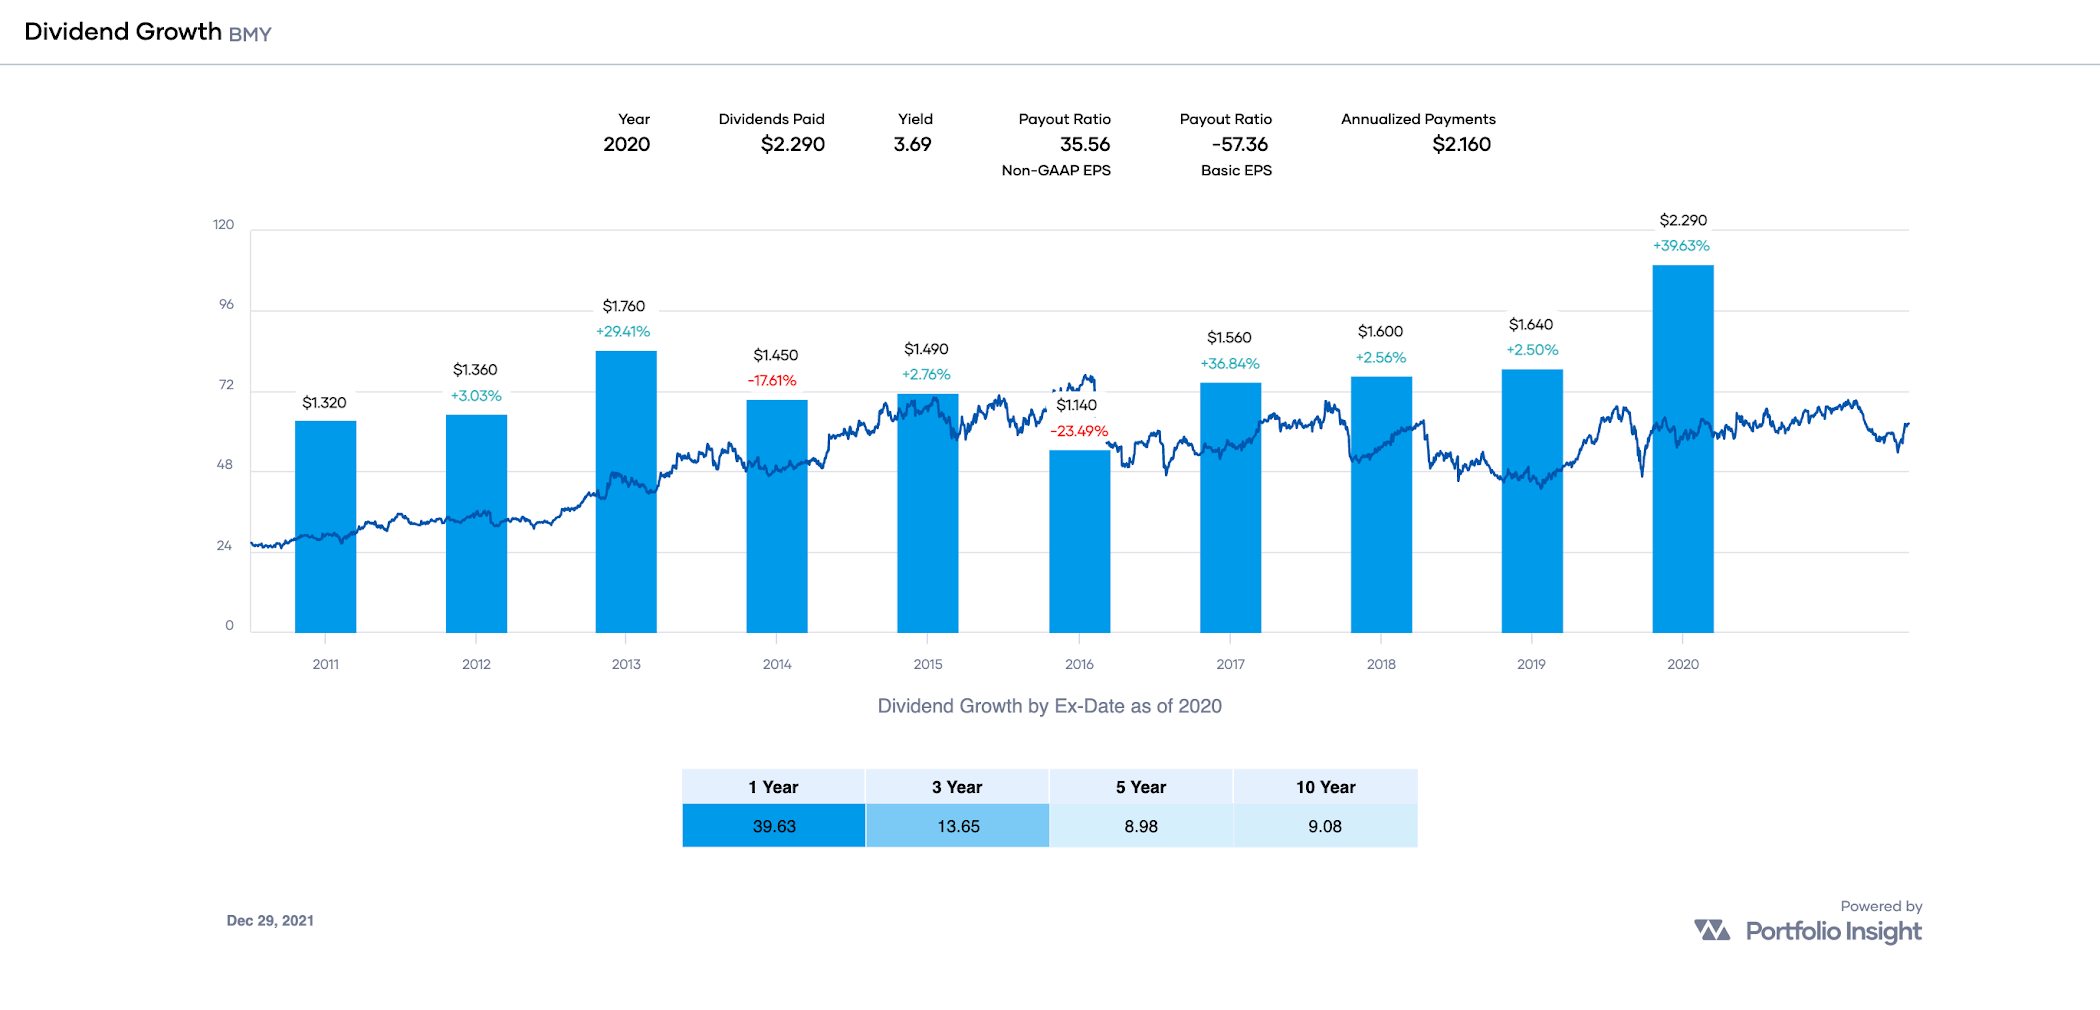
BMY's dividend growth is somewhat inconsistent and certainly not what dividend growth investors would like to see. Note that BMY's dividend streak is 15 years, based on the declaration date of dividends, whereas the chart above shows BMY's dividends based on the ex-dividend date.
In contrast to its dividend growth chart, BMY's earnings growth chart looks very consistent!

In fact, BMY's earnings growth is accelerating, which can be seen by dividing its 5-year EPS Growth rate by the 10-year counterpart: 26.22 ÷ 11.54 = 2.27. A factor above 1.00 means an accelerating growth rate.
BMY's payout ratio of 27% is "low for biotechs", according to Simply Safe Dividends:

The dividend is considered Safe and the company has ample room to increase its dividend for years to come!
Let's now consider BMY's valuation. A quick way to estimate fair value is to divide the annualized dividend ($2.16) by the stock's 5-year average yield (2.98%). That results in a fair value [FV] estimate of $72 based on BMY's dividend yield history.
For reference, Morningstar's FV is $68 and Finbox.com's FV is $89.
My own FV estimate of BMY is $79.
The average of the four value estimates is $77. Given the stock's current share price of $62.35, it would appear that BMY is trading about 19% below fair value.
Here are the most recent Seeking Alpha articles covering BMY:
- Very Bullish: Bristol-Myers: Disciplined Investors Shall Be Rewarded, by Justin Kelso
- Bullish: It's A Good Time To Buy Bristol-Myers Squibb, by Jonathan Weber
- Bullish: Bristol-Myers Squibb: Underperformance Is Temporary, by The Value Portfolio
Conclusion: BMY is a high-quality dividend growth stock trading below fair value. For stocks rated Excellent, I'm willing to pay up 5% above my fair value estimate, putting my Buy Below price at is $81 per share. For conservative investors, a buy below $71 would be more appropriate.
This article was written by
Disclosure: I/we have a beneficial long position in the shares of APD, BMY, CMCSA, CSCO, ITW, MA, SYK either through stock ownership, options, or other derivatives. I wrote this article myself, and it expresses my own opinions. I am not receiving compensation for it (other than from Seeking Alpha). I have no business relationship with any company whose stock is mentioned in this article.
Additional disclosure: Please note that we're not recommending BMY or any of the stocks listed in this article. Readers should do their own research on these companies before buying shares.
Recommended For You
Comments
Related Stocks
| Symbol | Last Price | % Chg |
|---|---|---|
APD | 304.26 | 0.62% |
Air Products and Chemicals, Inc. | ||
BMY | 62.35 | -0.27% |
Bristol-Myers Squibb Company | ||
CAHCardinal Health, Inc. | 51.49 Post. 51.44 | -0.37% -0.10% |
CMCSAComcast Corporation | 50.33 Post. 50.46 | -0.51% 0.26% |
CSCOCisco Systems, Inc. | 63.37 Post. 63.41 | -0.39% 0.06% |
- Get link
- Other Apps


Comments
Post a Comment